Summary
In this project, I undertook a comprehensive analysis of the NYC Airbnb dataset, employing various Machine Learning models to predict the popularity of Airbnb listings. The primary proxy indicator used to gauge popularity was the “reviews per month” column from the dataset. This project was anchored on the assumption that this metric could effectively represent a listing’s popularity based on the available data. The significance of this endeavor lies in the potential for a Machine Learning model to uncover the influential factors behind an Airbnb listing’s popularity. Not only can this assist Airbnb hosts in crafting more compelling advertisements, but it also has the potential to enable Airbnb as a company to refine its business model by focusing on promising and selective listings. Ultimately, this approach enhances the user experience for renters, promoting a more positive Airbnb experience.
Model Selection and Performance
After rigorous experimentation with multiple Machine Learning models, I found that the ensemble model, specifically the Light Gradient Boosted Machine (LGBM), delivered the most promising results. This model achieved an impressive R-squared score of 0.68 on the test data, signifying its competence in predicting listing popularity. This score ranges from 0 (indicating a random model) to 1 (representing a perfect model), thus highlighting the model’s reliability with scope for further refinement.
Key inferences
Through this analysis, key insights emerged. To enhance the popularity of their listings, Airbnb could consider promoting hosts who offer their properties for more days throughout the year. Additionally, hosts who permit longer subsequent stays could potentially see an increase in the popularity of their listings.
Data
The dataset used in this project encompasses a wide array of parameters pertaining to Airbnb listings in the NYC area, with data collected in 2019. This dataset includes host attributes such as host_id, host_name, calculated_host_listings_count, and geographical attributes like latitude and longitude. It also encompasses advertisement-specific features like room_type, price, minimum_nights, and number_of_reviews, among others. The dataset was sourced from kaggle. Each row in the dataset represents the attributes of a distinct Airbnb listing in the NYC region.
A correlation plot was generated for the finalized features to discern linear relationships with the target variable. It’s important to note that Pearson’s correlation solely indicates linear relationships and doesn’t account for potential non-linear associations.

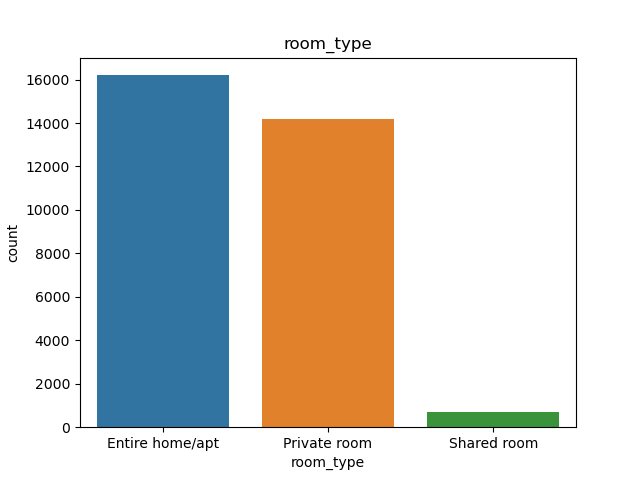
Barplots of the categorical features reveal imbalances in category distribution.

Analysis
To enrich the dataset, I performed Sentiment Analysis on the reviews, generating new features. These features were then meticulously scaled, transformed, and partitioned into training and testing datasets. The training dataset was used for model training, cross-validation, and model selection, while the test dataset allowed for the final evaluation of the best-performing model. The relationship between the features and the target variable “reviews_per_month” is inherently non-linear. This intuition was investigated by first using linear models such as RidgeCV, Lasso and LinearRegressor. The analysis progressed to next stage and it became evident that non-linear models offered superior performance. These non-linear models included Decision Trees, Random Forests, and Ensemble models. Hyperparameter tuning was conducted to optimize the best-performing model.
Results
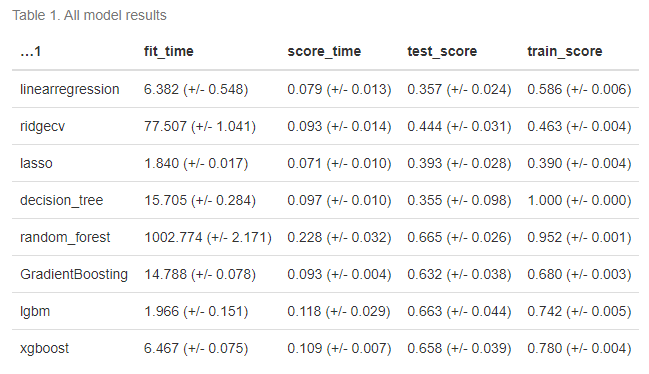
The initial intuition leaned towards linear models, but they did not yield satisfactory results. The best-performing linear model achieved an R-squared score of 0.440 (+/- 0.031). In contrast, non-linear models demonstrated significantly better performance. The Decision Tree model, while overfitting, achieved a perfect train score of 1.000 (+/- 0.000) and a validation score of 0.355 (+/- 0.098). The Random Forest model performed well, albeit still suffering from overfitting with a train score of 0.952 (+/- 0.001). The Gradient Boosting Machine model showed promise, with train and validation scores displaying minimal variance, resulting in an overall validation score of 0.632 (+/- 0.038). The Light Gradient Boosting Machine (LGBM), characterized by its efficiency, achieved a validation score of 0.663 (+/- 0.044), outperforming other models with significantly reduced fit time. The XGBoost model, known for its computational speed, achieved a good performance with a validation score of 0.658 (+/- 0.039).

The decision to select the best model factored in model performance based on the R-squared metric and computation time. Given the preference for reduced computational burden in real-world applications, I chose LGBM as the preferred model. I tuned the hyperparameters for LGBM to enhance its performance. The Root Mean Squared Error (RMSE) on the unseen test data for the best LGBM model ended up as 0.95, while on the training data, it stood at 0.59. The R-squared score of 0.68 on the test data, compared to 0.88 on the training data, signifies the model’s suitable effectiveness in predicting listing popularity.
Recommendations
Notably, the features “days_since_last_review” and “number_of_reviews” emerged as significant factors influencing listing popularity. However, from a business perspective, these factors may not be actionable. On the other hand, “minimum_nights” and “availability_365” proved to be actionable features. Airbnb could consider promoting hosts who make their properties available for more days throughout the year and those who permit longer stays, as these measures are likely to enhance listing popularity.