• Manchester United in 2022-2023 EPL Season

    A Statistical simulation assessment

    Post thumbnail
    Post thumbnail

    Introduction

    After a poor start to the season with defeats against Brighton and Brentford in their opening two games of the Premier League 2022/2023 season, Manchester United seemed to be continuing their previous forgetful season form. The previous season they had finished 6th in the League and failed to qualify for the UEFA competition. With a 2021/2022 season with 58 points (their lowest ever seasonal tally), 56 conceded goals (their most conceded) and 16 wins (their fewest ever seasonal victories), things could only be expected to improve. However, the shaky start was aggravated by the power battle between the new manager — Erik Ten Hag (ETH) and the club and football Icon — Cristiano Ronaldo. ETH is often regarded as the next influential manager who can not only compete with the likes of Pep Guardiola and Jürgen Klopp, but also provide dynamic attacking football, a trait long associated with Manchester United. Those who follow EPL closely will agree the 2022/2023 season turned out to be roller coaster of a ride for Manchester United. With the ebbs and flows, Manchester United finished the season strongly in third place and won the Carabao Cup trophy, their first trophy since 2016/2017 season.

    [Read More]
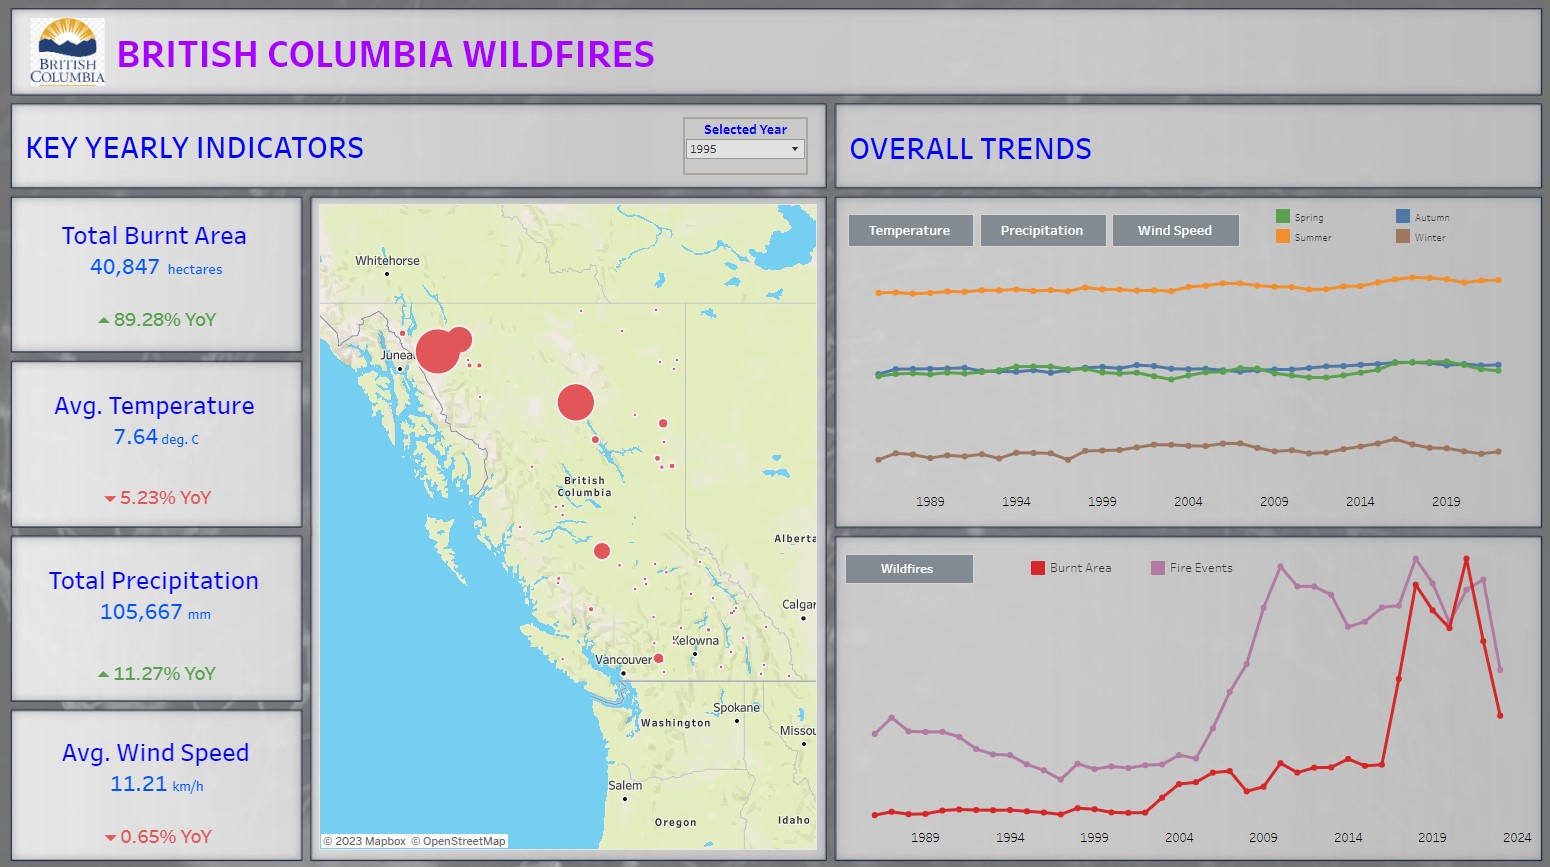
  • Wildfires in British Columbia

    Tableau Dashboard

    Post thumbnail
    Post thumbnail

    Summary

    There is an increasing focus on mitigation of extreme weather events across the world. The fallacy of mankind is perhaps the tendency to value short-term benefits in the face of long-term detriments. While manifesting in different forms ; floods, heatwaves, droughts, wildfires - the ongoing weather patterns have forced governments to make pre-emptive efforts to avoid further escalation. British Columbia, had its worst wildfire season, surpassing the previous record set in 2018. Thus it is essential to understand if there is a direct correlation between the climate factors such as temperature, precipitation and surface winds and the severity of wildfires. These “apparent” correlations that need to be statistically verified which could be a further extension of this project which mainly portrays the visualization of the existing data after data cleaning. Here is a brief overview, and links to my Dashboard and Github

    [Read More]
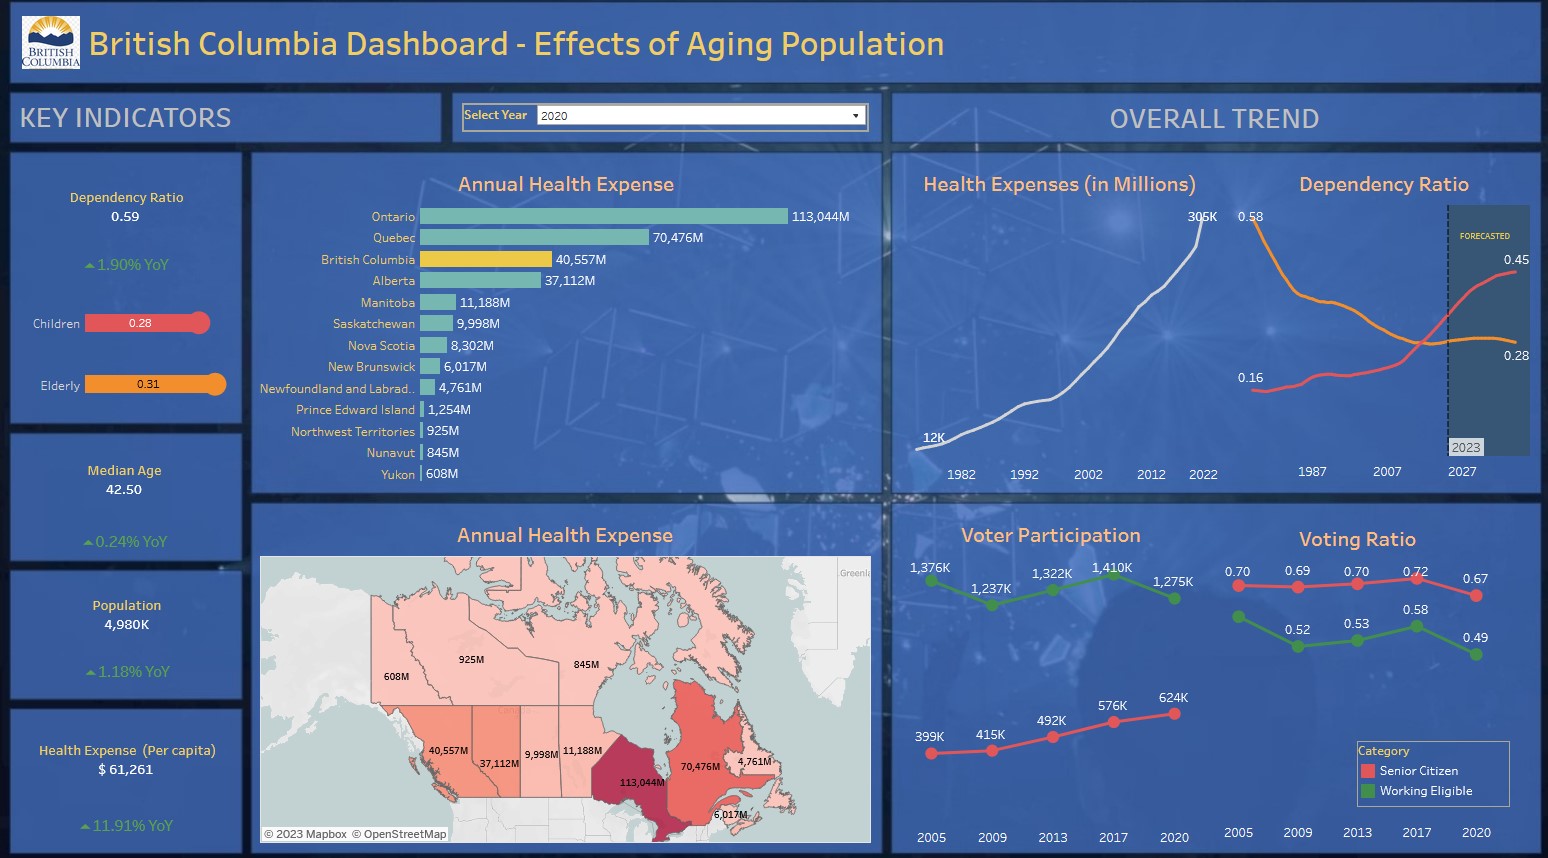
  • Aging in British Columbia

    Tableau Dashboard

    Post thumbnail
    Post thumbnail

    Introduction

    I lived at the core of the city of Vancouver while attending school at UBC. My walks around my neighborhood often made me observe that the general population in the city is senior relative to other cities I have experienced. A quick look at some datasets ascertained my observation. While this might be indicative of an successful healthcare system, I assess that a major concern might loom on the horizon not just for Vancouver, but perhaps the province itself. In this article, I will discuss my analysis of the open source data collected from government websites referenced below. I created an interactive Tableau dashboard that let’s you assess the three distinct datasets in a single visual while providing you the flexibility to filter it by the year of interest. Your perceptions might reveal new insights or limitations, please feel free to share it with me. Here I capture the background of the analysis and it’s limitations.

    [Read More]
  • Predicting Student Dropout

    Using ML algorithms to predict student dropout from college

    Post thumbnail
    Post thumbnail

    Introduction

    In the realm of academia, the performance and graduation rates of students play a pivotal role in shaping their employability prospects, contributing significantly to overall economic development. This Data Science project revolves around predicting student dropout rates by leveraging a multitude of factors encompassing demography, socioeconomics, macroeconomics, and pertinent academic data, which students provide upon enrollment. The significance of this prediction lies in its potential to shed light on a student’s academic journey and capacity. This knowledge serves as a valuable resource, aiding in the identification of key areas for improvement, such as the development of socially disadvantaged communities, enhancement of academic programs, and the creation of educational funding initiatives. My project aims to explore the following research question:

    [Read More]
  • Simplifying Survey Analysis with Sentiment Analysis Package

    Package creation in R and Python

    Post thumbnail
    Post thumbnail

    Motivation

    In the realm of data analysis, deciphering written comments from surveys can often be a time-consuming and arduous task. Extracting valuable insights or obtaining a quick summary from a sea of responses can pose a significant challenge. This is where the Sentiment Analysis Package, a project I’ve been actively involved in, steps in to streamline the process. The primary aim of this package is to swiftly summarize survey responses, providing a concise overview of sentiments within the comments. This tool serves a variety of purposes, from assisting PR teams in gauging the overall sentiment surrounding a company to aiding instructors in understanding the sentiment within a course. The key objective is to offer an easily interpretable summary by combining the capabilities of a pre-trained Python natural language processing package with intuitive visualizations.

    [Read More]